Sales By Salesperson
See how each individual salesperson is contributing to your overall company sales.
View and change the sales person for a job in the designer under JOB.
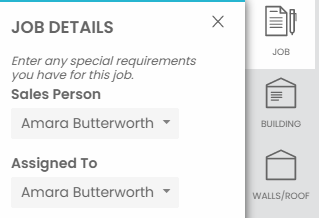
This may be different to the Assigned To person who is managing the job.
Here your performance indicators for the company are spread out showing each individual salespersons contributing value. This is a great way to track how your staff is working and reward them for their efforts.
Below each Salesperson’s name will also be the date and time of their last login to the system.
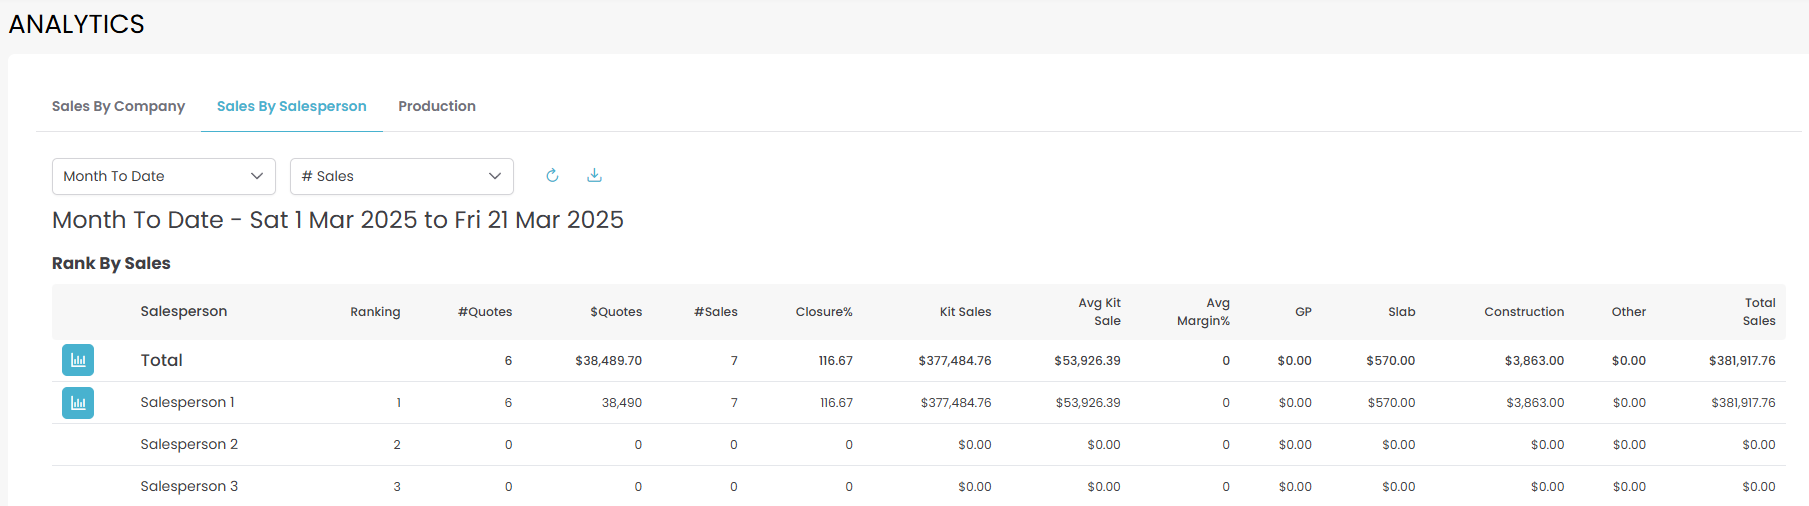
Just like the Sales By Company page this data can be manipulated to reflect different time periods.
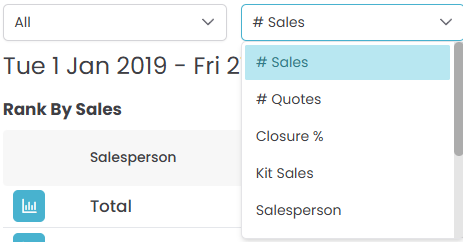
Select from the menu or choose CUSTOM to select your own date range.

This list can be ranked alphabetically or by each individual performance indicator shown.
Use the second drop-down to select how your salespeople are ranked.
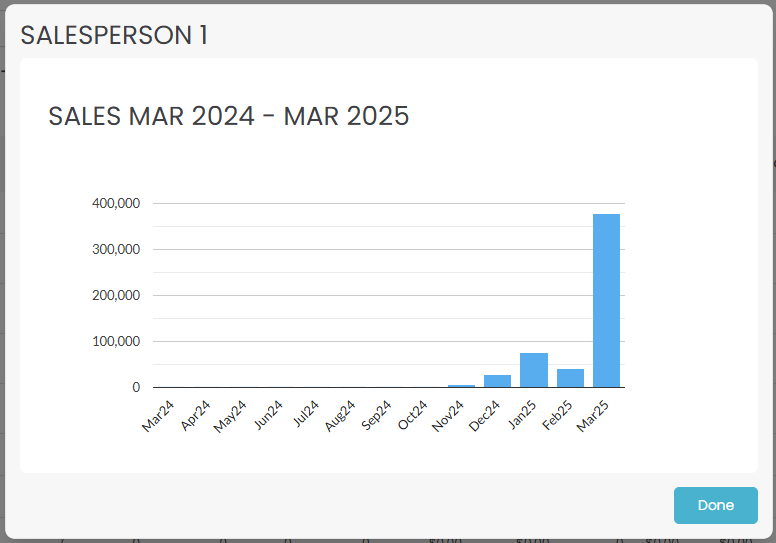
Annual Sales Graph
To view a annual sales graph for any of your users select the graph icon to the left of their name.
This will show the below sales graph for the last year to date.
Hover over any of the months on the graph to view the value of that month.
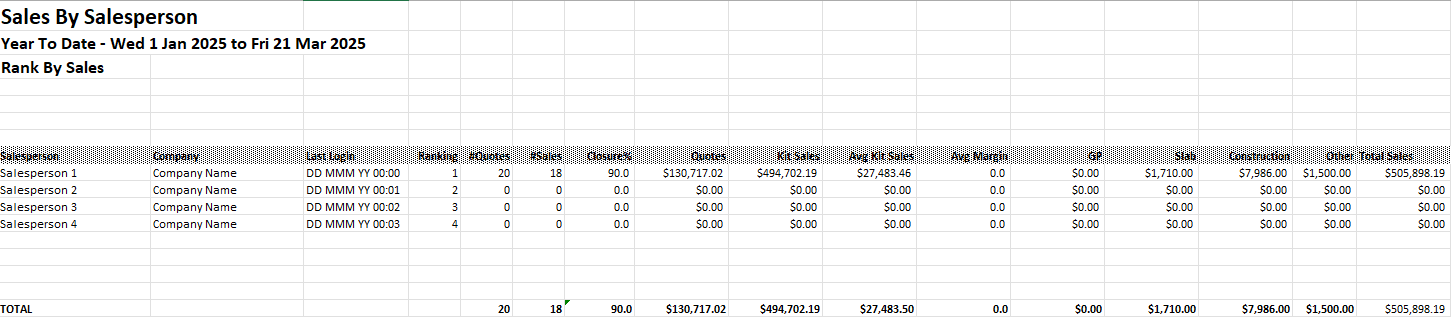
Download Your Overview
You can also download this salesperson overview by clicking the download button near the top of the page.

This overview will show like your Quotec screen with each individual salesperson’s KPI’s and a total.