Sales By Company
The Sales By Company tab shows an overview of your company KPIs
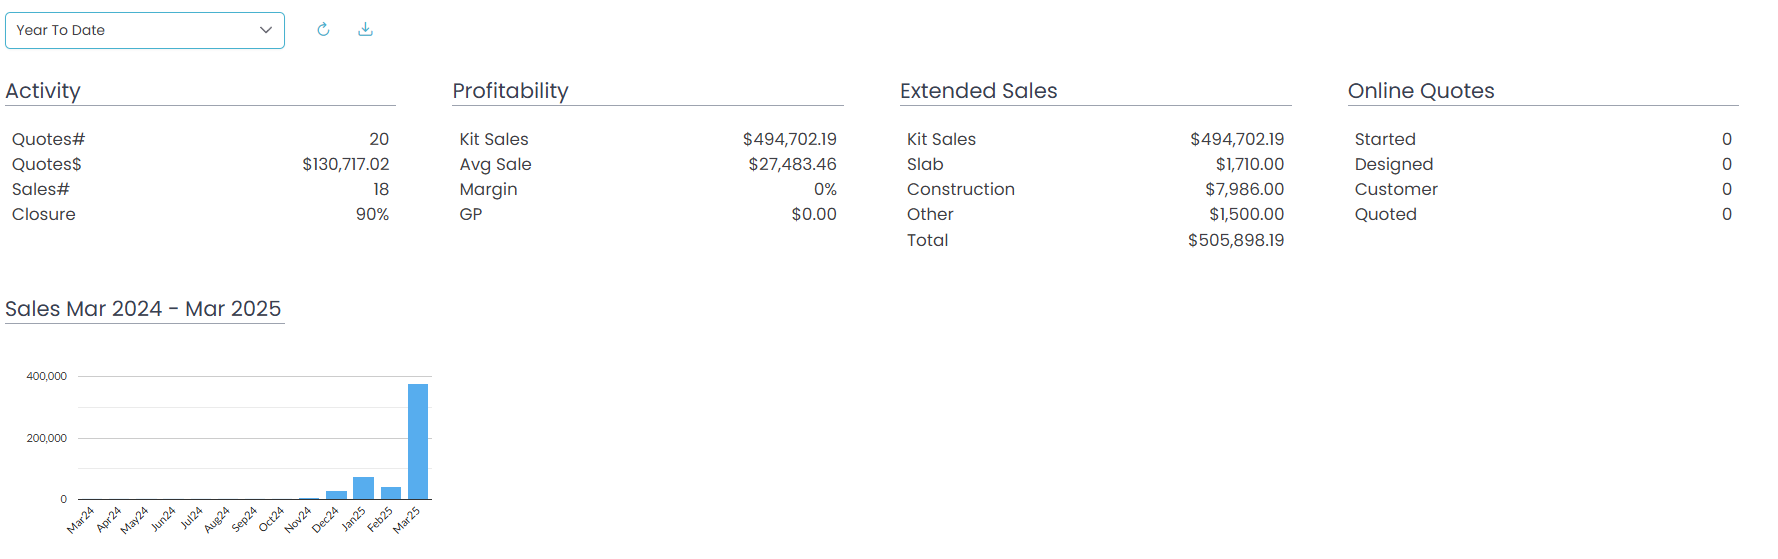
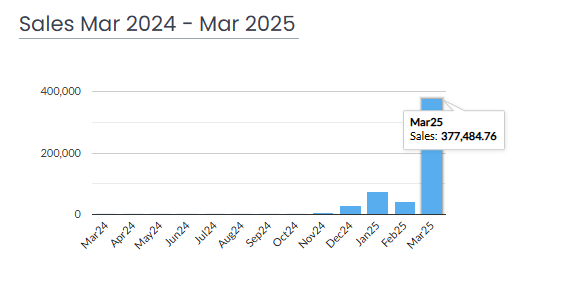
At the bottom of this screen is a graph showing the value of sales for each month over the last year.
Hover over the bar to view the sales value for that month.
Above this is a more detailed break-up of your company data spilt into four different sections.
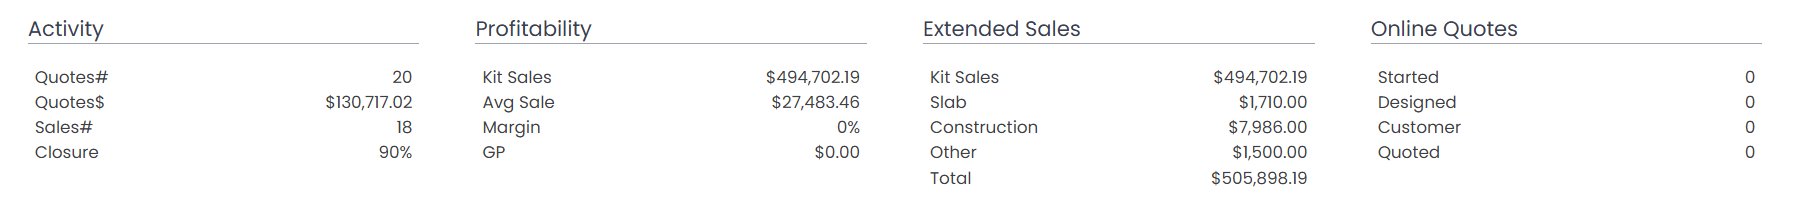
Activity
See what your closure rate is converting quotes into sales.
Profitability
See the total value of kit sales for the selected date range, the average sale value, and your gross profit from that range.
Extended Sales
In addition to your Kit Sales, see the sum of values added to your quotes for Slab, construction and any other extra costing.
Online Quotes
This shows how potential customers are progressing through your Quotec Now add on.
Started - They opened your Quotec Now page however didn’t fill in an address
Designed - They selected a building type and filled in their address, progressing to start a design
Customer - They did a design and were asked for their name and contact details
Quoted - They filled in their name and contact details and were sent a quote
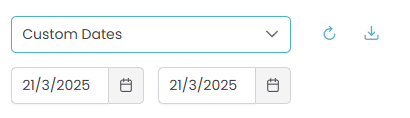
This data can be manipulate to reflect different time periods. Use the drop-down at the top to select the range you wish to see data for. Once you’ve selected your period click the refresh button next to it to see the new data.
Select CUSTOM to then select whatever date range you want.
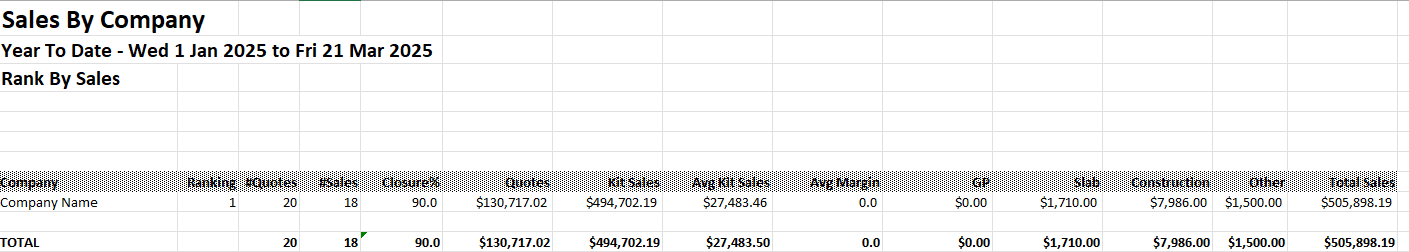
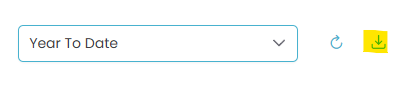
Download Your Overview
Click the download button near the top of the page for an excel file showing company data for the selected time period.
The downloaded excel file will look like this: